
Use the Mosaic Grid command on the Tools menu to define rectangular overlay on the Sky Chart composed of evenly spaced rectangular regions (called tiles). The tiles’ dimensions can be specified as an angular height and width or based on a pre-defined field-of-view indicator (FOVI).
Once the mosaic grid is created, slew the telescope to the center of each tile and take a photo. The photos collected by repeating this process for each tile in the grid can be combined into a single larger photo using third-party image processing software.
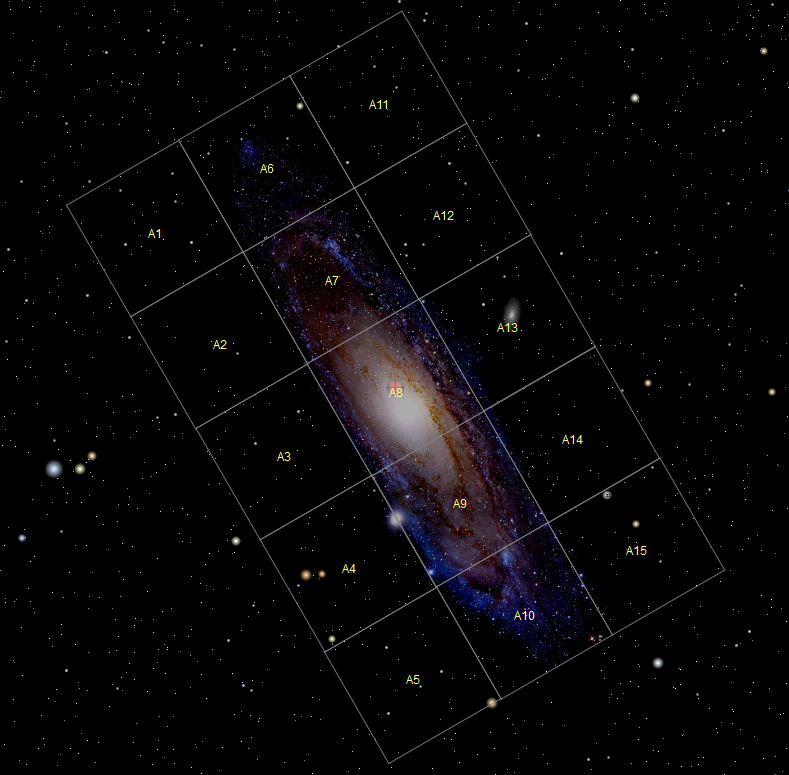
Figure 139: Sample mosaic grid on the Sky Chart.
1. Select the Mosaic Grid command from the Tools menu to show the Mosaic Grid window (Figure 141) to generate the primary mosaic grid. Each tile in the primary mosaic grid is prefixed with the letter A followed by the numerical position of the tile in the grid (A1, A2, A3 and so on).
Clicking the mouse on a tile’s label identifies it as the target object on the Find window (page 62). Figure 140 shows the Sky Chart when the tile labeled A7 is clicked.
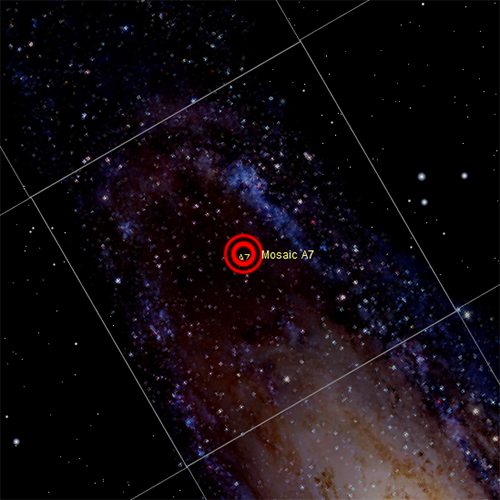
Figure 140: Click on the mosaic label A7 to show the target object name Mosaic A7.
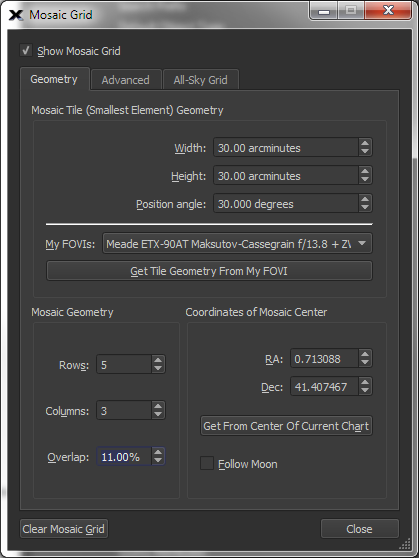
Figure 141: The Mosaic Grid window.
Use the options on the Geometry tab to define the Width and Height, in arcminutes, of each mosaic tile and each tile’s rotation, or Position Angle, in degrees, measured counterclockwise from the celestial pole. Or, select a field of view indicator that has been defined on the My FOVIs tab on the Field of View Indicators window (page 125) and click the Get Tile Geometry From My FOVI button to fill in the geometry values.
|
|
Position Angle Note
The tile is the fundamental element of the mosaic. Therefore, the mosaic tile’s Position Angle defines the position angle of the entire mosaic. In other words, there’s no way to define a position angle for the entire mosaic that is different than the individual tile’s position angle.
|
Enter the number of Rows and Columns in the mosaic grid, the percentage Overlap of the tiles in the mosaic grid and the grid’s location on the celestial sphere, in RA, Dec coordinates.
Turn on the Follow Moon checkbox to have TheSky slew to the current position of the Moon, instead of a fixed position.
Turn on the Show Mosaic Grid checkbox to show the mosaic grid on the Sky Chart.
2. To create a larger grid that duplicates the original, click the Advanced tab. The options on the Advanced tab are used to duplicate the primary mosaic grid on the Sky Chart that is at “mosaic-grid sized” X and Y offsets.
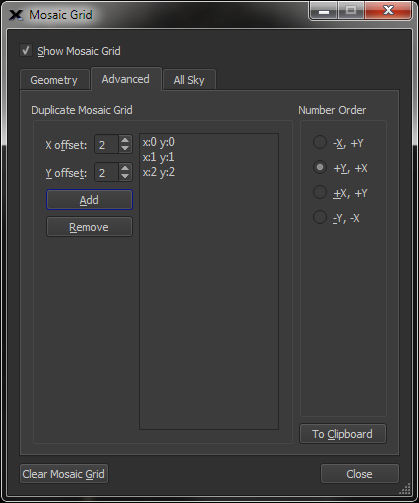
Figure 142: Advanced tab on the Mosaic Grid window.
Enter the horizontal (x-axis) and vertical (y-axis) offset for the duplicated mosaic grid. The offset unit is defined as the “width of the primary mosaic.” For example, a X Offset value of 1 and Y Offset value of 0 places the duplicate mosaic’s upper left corner next to the primary mosaic’s upper right corner. (The offsets are always relative to the upper left corner of the primary mosaic.)
An offset of 0, 0 is allowed and places the duplicate mosaic grid directly on top of the primary mosaic. The mosaics centers are numbered starting at one through the total number of mosaic regions. Mosaics are ordered alphabetically.
Click the Add button to create the new mosaic and add the offset to the mosaic replication list.
3. Specify the numbering convention for the mosaic centers.
· -X, +Y: Mosaic tile numbers are incremented right to left by row, starting in the upper right corner of the mosaic.
· +Y, +X: Mosaic center numbers are incremented top to bottom by column, starting in the upper left corner of the mosaic.
· +X, +Y: Mosaic center numbers are incremented left to right by row, starting in the upper right corner of the mosaic.
· –Y, +X: Mosaic center numbers are incremented bottom to top by column, starting in the lower left corner of the mosaic.
Click the button to copy the equatorial coordinates of the centers of selected mosaic to the Clipboard. These coordinates can be used to generate a script that slews your telescope to each position.
Sample mosaic grid data:
1 A 0 9.32121655 -29.04969590
2 A 1 9.32119169 -28.89969638
3 A 2 9.32116702 -28.74969737
4 A 3 9.32114254 -28.59969785
5 A 4 9.30977751 -29.04991248
6 A 5 9.30976922 -28.89991265
7 A 6 9.30976100 -28.74991333
8 A 7 9.30975284 -28.59991349
9 A 8 9.29833849 -29.04991248
10 A 9 9.29834678 -28.89991265
11 A 10 9.29835500 -28.74991333
12 A 11 9.29836316 -28.59991349
13 A 12 9.28689945 -29.04969590
14 A 13 9.28692431 -28.89969638
15 A 14 9.28694898 -28.74969737
16 A 15 9.28697346 -28.59969785
Once you have slewed your telescope to a given frame, parentheses are placed around the number in the center of the block, indicating that this frame has been imaged. If you wish to start the mosaic process over, click this button to clear all the parentheses.
TheSky Professional Edition can create a mosaic grid that covers the entire celestial sphere (or, optionally just the northern half of the celestial sphere). The grid can aid in producing an all sky photograph or performing an all sky survey.
|
|
The maximum number of frames in an all sky mosaic grid is limited to about 15,000 frames. This means each frame must cover about four square degrees or more, depending on the overlap. |
For each frame generated, the camera position angle is assumed to be north up, or north down. The grid computations do not consider camera rotation angles outside these two orientations.
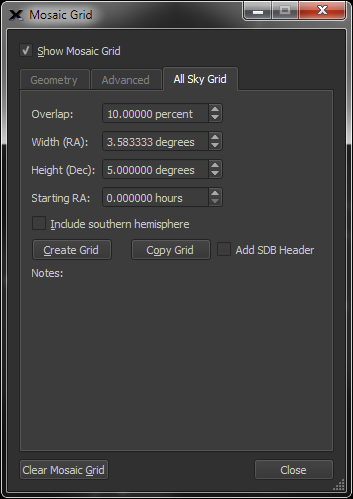
Figure 143: The All Sky Grid pane.
Enter the percentage of overlap for each tile in the mosaic grid.
Enter the angular width, in degrees, of each tile.
Near the celestial equator, the distance around the celestial sphere is nearly 360 degrees, so the number of frames will be near 360 divided by the Width (RA) value. As the declination increases, or decreases, the number of frames around the particular declination decreases. Each declination band starts at RA 0.0, unless a different value is entered in the Starting RA text box.
Once a grid is computed, it will be displayed on screen, and the text on the Create Grid button changes to Clear Grid.
The celestial sphere is divided into declination “bands” based on the Height (Dec) input value and the overlap percentage. For example, a Height of 5 degrees with a 10% overlap will yield declination bands that are spaced at 4.5-degree intervals.
Enter the right ascension, in decimal hours, to start the all sky grid.
Click this button to create a mosaic grid that covers the northern hemisphere using the FOVI from the Geometry pane.
Turn on this checkbox to create the grid for the entire celestial sphere.
Click this button to copy the grid centers to the Clipboard in XML. This format can be used to quickly generate a Sky Database of the grid or imported into a spreadsheet application.
<?xml version="1.0"?>
<!DOCTYPE TheSkyDatabase>
<TheSkyDatabaseHeader version="1.00">
<identifier>Mosaic</identifier>
<sdbDescription>Locations of Mosaic centers</sdbDescription>
<specialSDB>0</specialSDB>
<plotObjects>1</plotObjects>
<plotLabels>1</plotLabels>
<plotOrder>0</plotOrder>
<searchable>1</searchable>
<clickIdentify>1</clickIdentify>
<epoch> 2000.0</epoch>
<referenceFrame>0</referenceFrame>
<crossReferenceType>0</crossReferenceType>
<defaultMaxFOV> 360.0000</defaultMaxFOV>
<defaultObjectType index="62" description="Mosaic point"></defaultObjectType>
<raHours colBeg="12" colEnd="23"></raHours>
<decDegrees colBeg="25" colEnd="36"></decDegrees>
<majorAxis colBeg="38" colEnd="43"></majorAxis>
<minorAxis colBeg="45" colEnd="50"></minorAxis>
<positionAngle colBeg="52" colEnd="57"></positionAngle>
<labelOrSearch colBeg="1" colEnd="10"></labelOrSearch>
<sampleColumnHeader>
;dentifier RA Dec;--------- ------------ ------------</sampleColumnHeader>
</TheSkyDatabaseHeader>
Identifier RA Dec Wid Ht PA
---------- ------------ ------------ ------ ------ ------
Mp0 11.68432400 0.00000000 226.83 151.25 0.00
Mp1 11.92194776 0.00000000 226.83 151.25 0.00
Mp2 12.15957152 0.00000000 226.83 151.25 0.00
Mp3 12.39719529 0.00000000 226.83 151.25 0.00
Mp4 12.63481905 0.00000000 226.83 151.25 0.00
Mp5 12.87244281 0.00000000 226.83 151.25 0.00
Mp6 13.11006657 0.00000000 226.83 151.25 0.00
Mp7 13.34769034 0.00000000 226.83 151.25 0.00
When the Copy Grid button is clicked, and this checkbox is turned on, the grid center positions are copied to the Clipboard in an XML format so that the grid can be compiled and displayed as a Sky Database (page 282).
Once a link with the telescope is established, click anywhere within one of the mosaic tiles, and the telescope will automatically slew to its equatorial center.
If you are viewing or photographing the Moon, turning on the Follow Moon checkbox. The telescope’s tracking rate will automatically be set to the lunar rate. (The previous rate is restored when the mosaic is removed.)
Although each tile is numbered sequentially, you can slew to them in any order. (If TheSky’s window is not maximized, or the field of view is too small, the numbers might not be displayed to avoid screen clutter.) A selected frame’s border changes color from magenta to red, to indicate that is has been “visited.” To reset each tile to its original color, click the Reset Slewed button.
If you are using the Mosaic Grid feature to take pictures, the CCD or DSLR camera must be aligned with the mosaic frames. You must therefore either position the camera to align it with the Sky Chart or orient the Sky Chart to the camera. TheSky can help you. Use Image Link to align one of your photographs with the Sky Chart, the “Image Link Information” gives the orientation of the image as an angular offset from North. You can then adjust the camera mount or the Sky Chart’s orientation accordingly.
The Mosaic feature works best with equatorial telescopes. Azm/Alt telescopes suffer from field rotation, which causes the field of view to gradually rotate. The severity of this effect varies with the altitude coordinates of the area being photographed, and the length of time needed to complete the photography. A field-rotation corrector might be needed.
